
Resin patterns obtained in vacuum-sealed sand moulds |
|
5. Wear-resistance of the resin patterns Regardless of the technology, one of the most important work properties of the patterns is their wear-resistance [25-37]. In the publications and standards the service life of the resin patterns is defined in quite wide limits. For example, H. Неinе [25] shows the following values for the service life of the epoxy patterns: 20-30000 in squeezing, 1500-5000 - in slingering, and 9-15000 - in blowing. Russian standard 19505 [26] regulates 2000-4000 cycles for the epoxy patterns in hand moulding, and 25-35000 - in machine moulding. J. Golding [27] shows an interval of 30-60000 mouldings for the polyurethane resin patterns without information of service conditions, and R. Ваilеу [28] - 50000 high squeeze moudings. That diversity of data ensues from the set of factors which influence on the wear - pattern surface geometry, type and proportion of the compound components, moulding method, etc. Here is proposed a simplified and easily applicable approach for the wear-resistance determination of the resin patterns made of different compounds. 5.1. Rotation in sand The initial step of the approach is the laboratory test for wear of samples (Fig.27), which are jig assembled in pairs to usual drilling machine and then they are rotated in pure silica sand with 95 rpm (Fig.28). Each two samples are changed with other couple through 30 minutes. The sand is 1PK0.25-70 (AFS GFN = 50.8), changed every two hours. These circumstances ensure heating of the samples no more than 35° C. 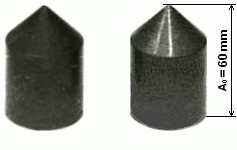
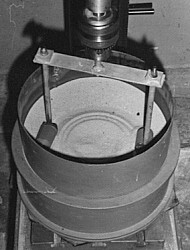 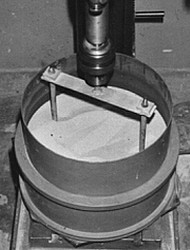
a) made in plastic mould; b) made in vacuum-sealed sand mould. a) the samples before the entering in the sand; b) the samples in the test time. Each sample goes 4152 m per hour. Every two hours or the same - after some way covered by the samples, the decrease of dimension A (Aо=60 mm) is measured. It includes the zone with the rounded top of the sample, which is worn to the limit. The list of tested compounds is shown in Table 1. They are distributed in three groups. The metal fillers are included in the 1st group (1-10), the mineral fillers with angular or fractured grains - in the 2nd group (11-20), and the mineral fillers with round grains - in the 3rd group (21-30). Table 1
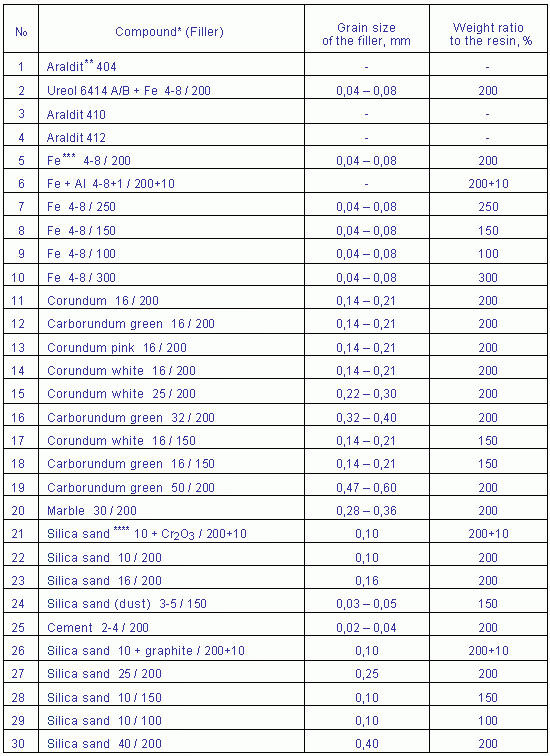 *In all compounds 5-30, the Bulgarian epoxy resin AP1 is 100 wt.%. **The compounds Araldit® and Ureol® are production of Ciba-Geigy, Switzerland. ***The Fe-dust is WPL, product of Mannesmann, Germany. ****Here are used only fractions of silica sand. In Fig.29 is presented the decrease of dimension A for all samples from vacuum-sealed sand moulds, and in Fig.30 - for ten chosen samples made in plastic moulds (marked with ' ). The results processing is done with Advanced Grapher 2.11 (2005). 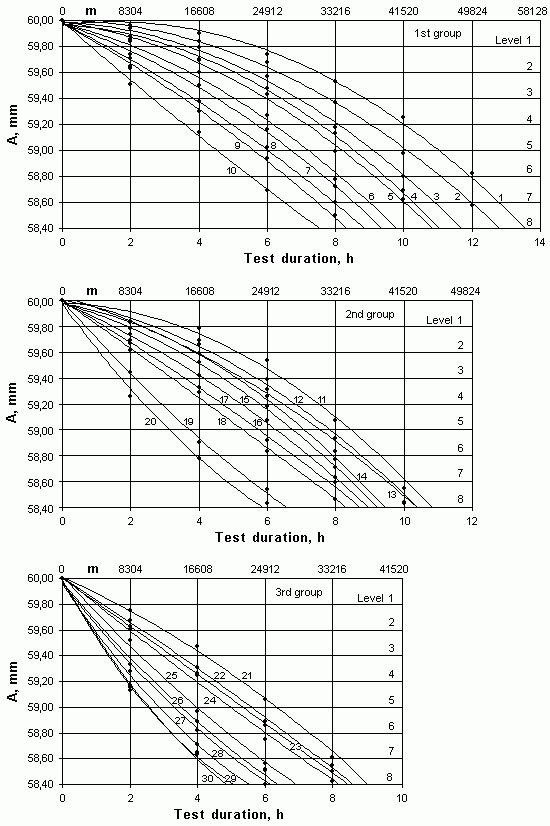 Fig.29. Wear in sand, results for samples made in vacuum-sealed sand moulds 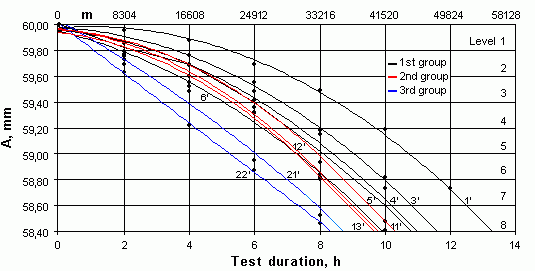 Fig.30. Wear in sand, results for samples made in plastic moulds In the test time, the dimension A falls in some group of tolerance fields. This group (set) would be more common and then it will have some equal levels with equal limits, or this set would be in according to some standard (or customer requirement) for permissible dimensional deviations of the patterns. In relation to the first possibility, here, the coordinate systems are divided into eight levels through 0.2 mm. The levels are closed between 60.0 and 58.4 mm and they have a fixed value, but in general case, the commitment of the levels with a concrete dimension should not be done. That permits the covering of all real patterns whose dimensions fall in dimensional range, for which the different accuracy classes of standards define permissible deviations up to 1.6 mm (or more with the extrapolation). The covered by the samples way L1-8 (in meters) in crossing the limits of the each level is shown in Tables 2 and 3. Table 2
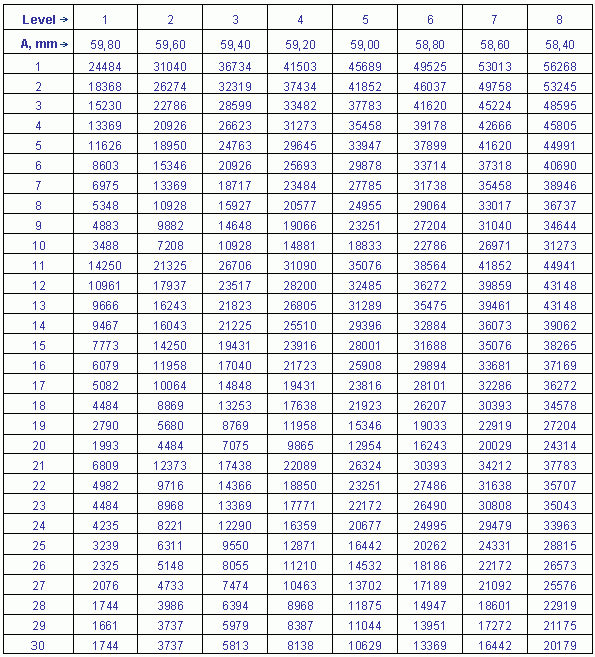 Table 3
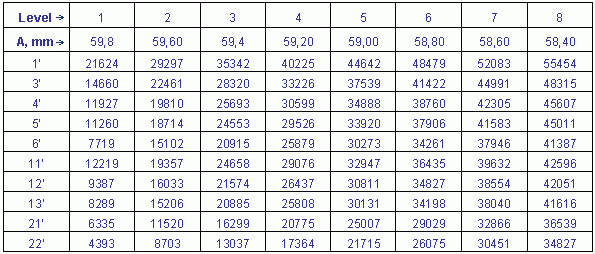 Further in this first point of the proposed approach a representative compound from each group is chosen. This compound is the most wear-resistant. For the 1st group this is compound 1, for the 2nd group - compound 11, for the 3rd group - compound 21. From data in Table 2, the coefficients K1-8 are computed (Table 4). They present a relation between each one of compounds of the group to their representative compound when they cross the levels 1-8. That relation is expressed by division of the meters, covered by the samples. For example, for fifth level К57/1 = L57 / L51 = 27785 / 45689 = 0.608. For the samples from the plastic moulds, coefficients K1-8 are computed too (Table 5), but as a relation to their corresponding representative compound from samples made in vacuum moulds. Table 4
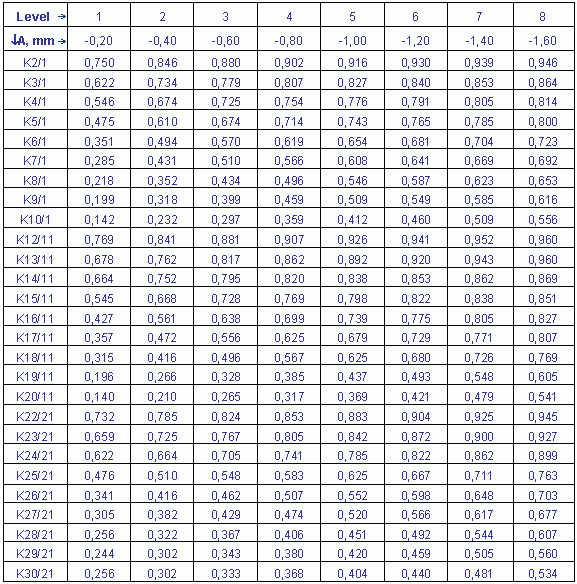 Table 5
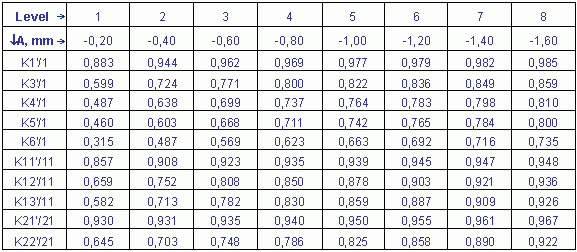 The determination of the coefficients К1-8 permits further tests only for the representative compounds of the three groups, which decreases the experimental work considerably, therefore it is possible the application of more hard realizable tests. The investigation of materials, which are out of shown in Table 1 is analogous. That is enough to obtain the data of erosion wear in sand with described simple equipment, to distribute to the respective group and to calculate coefficients K. The sample rotation in sand is easy and available, without special participation of operator, and does not contaminate the environment. In spite of these favourable factors, the wear is different from the real conditions of the patterns operation. « « « previous page next page » » » |